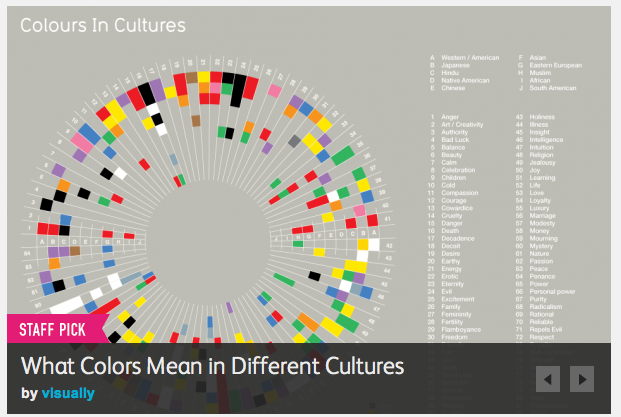

I'm playing around with
Visual.ly, a infographics and data visualizations marketplace and builder that just launched.
Infographics and data visualizations are a great way to experience stories and create a new way of seeing the world of data, one that helps communicate complex ideas in a clear and beautiful way.
Visual.ly has collected the best examplekinlane-productions2ganized them in a single directory for discovery, publishing and sharing.
Visual.ly also helps infographic designers build a portfolio, and showcase their work in the
Visual.ly directory, creating an infographic marketplace that anyone can particpate in.
Answering one of my wishes, and filling a huge need, Visual.ly is also building a tool that will allow anyone to quickly and easily
create professional quality infographic designs with their own data. When ready they also allow you to publish it on your Visual.ly profile, showcasing your own data visualizations.

Infographics are a essential tool for helping communicate stories and make sense of the big data that is emerging around us, across all industries. They will continue to be an essential part of integrating big data stories into
print and publications including magazines, books and business presentations.
I wrote a few months ago about the
need for an infographic Post Marketplace that allows you to order prints of infographic posters and popular data visualizations. I'll see what I can do to get
Visual.ly to integrate printing into toolset, or at least offer an API so someone else can offer print on demand infographic posters.

 I'm playing around with Visual.ly, a infographics and data visualizations marketplace and builder that just launched.
Infographics and data visualizations are a great way to experience stories and create a new way of seeing the world of data, one that helps communicate complex ideas in a clear and beautiful way.
Visual.ly has collected the best examplekinlane-productions2ganized them in a single directory for discovery, publishing and sharing.
Visual.ly also helps infographic designers build a portfolio, and showcase their work in the Visual.ly directory, creating an infographic marketplace that anyone can particpate in.
Answering one of my wishes, and filling a huge need, Visual.ly is also building a tool that will allow anyone to quickly and easily create professional quality infographic designs with their own data. When ready they also allow you to publish it on your Visual.ly profile, showcasing your own data visualizations.
 Infographics are a essential tool for helping communicate stories and make sense of the big data that is emerging around us, across all industries. They will continue to be an essential part of integrating big data stories into print and publications including magazines, books and business presentations.
I wrote a few months ago about the need for an infographic Post Marketplace that allows you to order prints of infographic posters and popular data visualizations. I'll see what I can do to get Visual.ly to integrate printing into toolset, or at least offer an API so someone else can offer print on demand infographic posters.
