
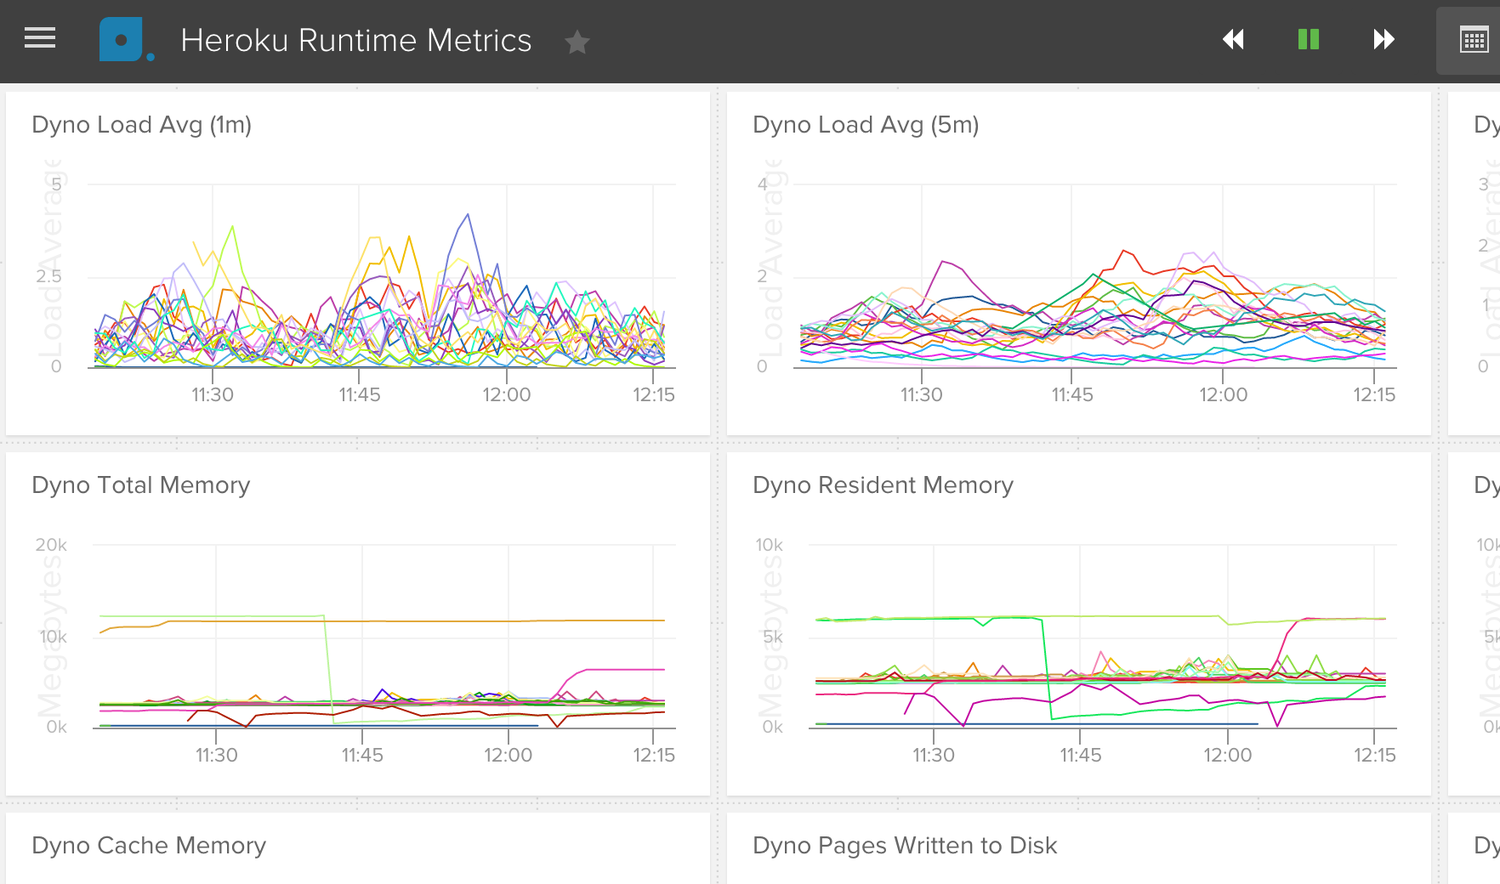
As I am working on the API and JSON driven visualization strategy for my Adopta.Agency open data work, I saw cloud monitoring platform Librato, publish their new "Space" interface as a Heroku add-on. I like dashboards and visualization tooling that can live on multiple platforms, and engineered to be as portable and deployable as possible.
In a perfect world, infographics would be done using D3.js, and would all show their homework, with JSON or API definitions supporting any visualizations. All of my Adopta.Agency projects will eventually possess a simple, embeddable, D3.js visualization layer that can be published anywhere. Each project will have its JSON localized in the publicly available Github repository, and be explorable via any browser using Github Pages.
The Librato approach reminded me that I'd also like to see modular, containerized versions of more advanced tooling, dashboards, and visualizations around some projects. This would only apply in scenarios where a little more compute is needed behind the visualizations, that could be done with simple D3.js + JSON, hosted on Github. Essentially giving me two grades of portable visualization deployment: light and heavy duty. I like the idea that it could be a native add-on, whereever you are deploying an open API or dataset.
I still have a lot of work to do when it comes to the light duty blueprint of JSON + D3.js, and API + D3.js, to support Adopta.Agency. I will focus on this, but keep in mind doing modular cloud deployments using Docker and Heroku for the datasets that require more heavy data lifting.