Understanding how the federal government spends our money is on all of our minds, especially this time of year. I recently pulled out an old tool I build last year to
visual the State of Oregon spending, and reworked it to help
visualize Obamas 2012 Federal Budget. I wanted to set what my priorities were regarding the federal budget. I'm not 100% finished, still have a little work to do on it.
Today I came across a very cool data visualization contest called the
Data Viz Challenge.
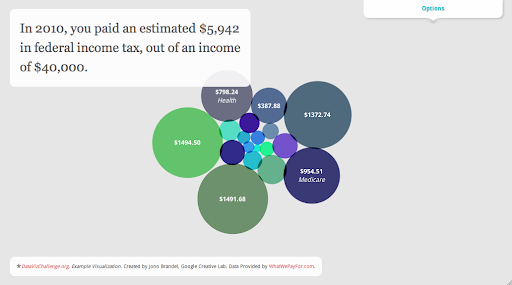
The Challenge: Visualize how your individual federal income taxes are spent.
Using data provided by
WhatWePayFor.com, they are challenge developers to create a data visualization that will make it easier for U.S. citizens to understand how the government spends taxpayers money.
There is $10,000 in prize money including $5,000 top prize. Entries must submitted by midnight of March 27, 2011 with finalists being announced the week of April 11, and winners will be publicly announced on Tax Day, April 18, 2011.
This challenge was created by
Eyebeam and
Google, with data provided by
WhatWePayFor.com.
What a great way to educate the American taxpayer through the use of open data, APIs and visualization!